SpecFit
Upload
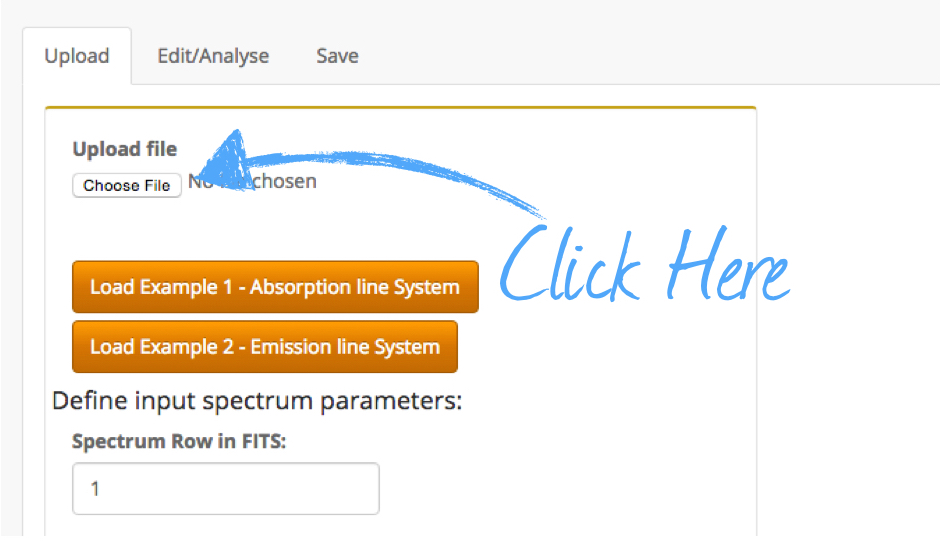
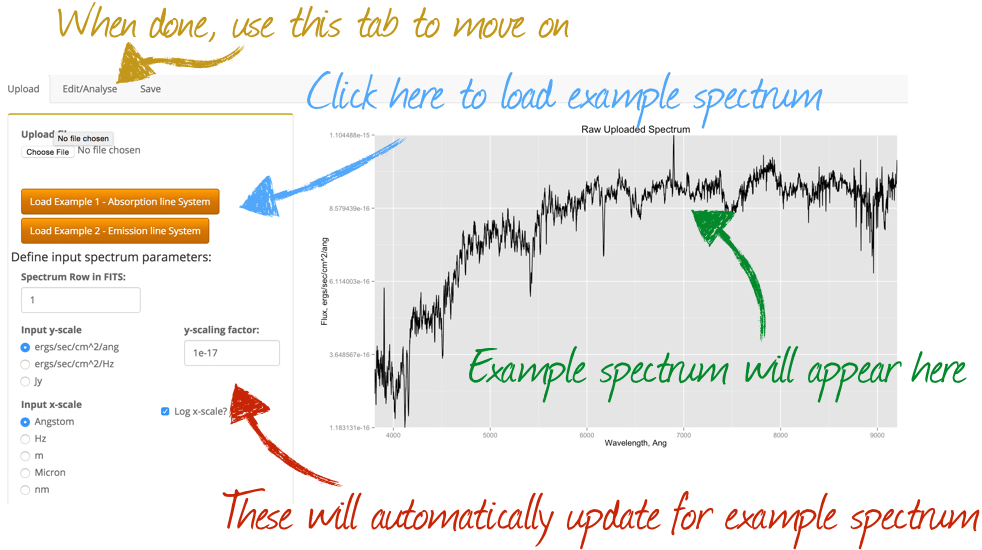
To upload your desired spectrum go to the "Upload" tab and use the "Choose File" button.
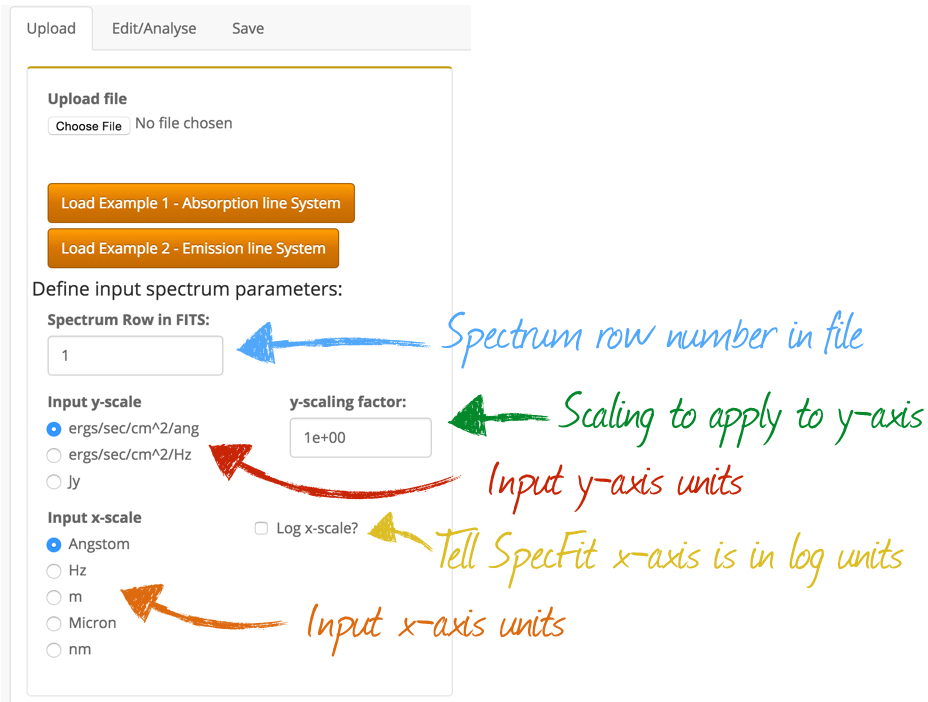
Once you spectrum is uploaded, you can tell SpecFit the various input paramters of your spectrum: the row in the FITs file you have uploaded, the flux units, the wavelength/frequency units, a scaling factor to be applied to the flux units and if the raw spectrum wavelength/frequency is in log units.
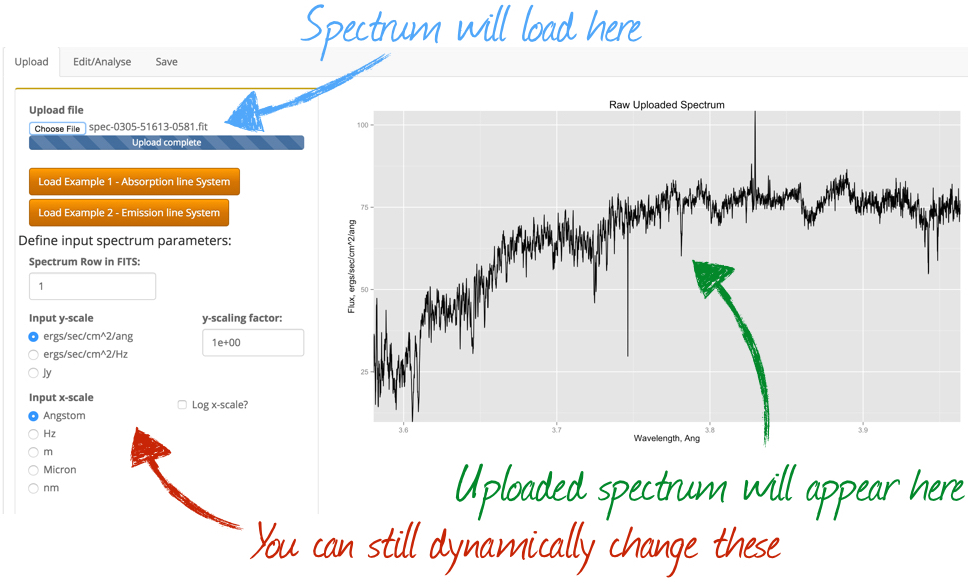
If you have uploaded your spectrum correctly it should appear in the main panel. You can dynamically change the spectrum inputs if you have made a mistake, and you can see the spectrum units and scaling in the main panel change with your choices.
You can also load one of two example SDSS spectra by clicking on the appropriate button.
Once you are happy with the uploded spectrum move the "Edit/Analyse" tab.
Edit & Analyse
Now that you have uploded your spectrum you can edit how it is plotted, change some of the spectrum properties, measure spectral lines and calculate redshifts.
The Plotting Window
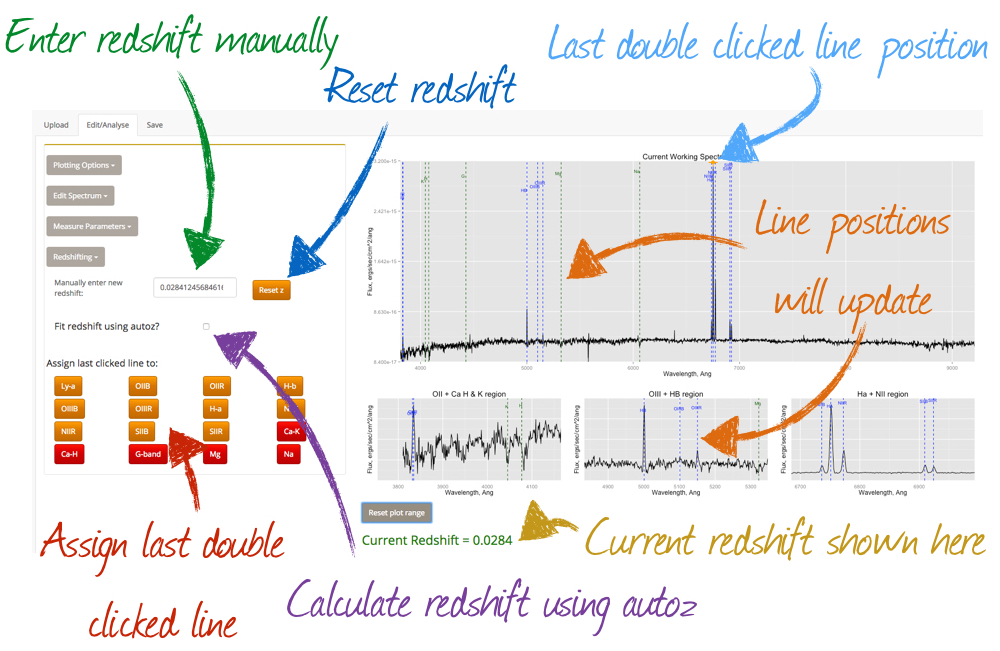
Firstly, your spectrum should still be displayed in the main plotting window. The window has four panels: a main panel showing the full spectrum, and three smaller panels showing zoomed in regions of key spectral features. If you hover over the main spectrum, you current cursor poition is shown below the plot. You can double click a position and SpecFit will record it (showing you an orange cursor and displaying the point values below the plotting window) or zoom in by clicking and dragging over a region of the main panel. If you wish to reset the zoom, click on the "Reset plot range" button. If SpecFit has sucessfully derived a redshift from the spectrum fits header, it will overlay key spectral lines at this redshift, and display the redshift below the plotting window.
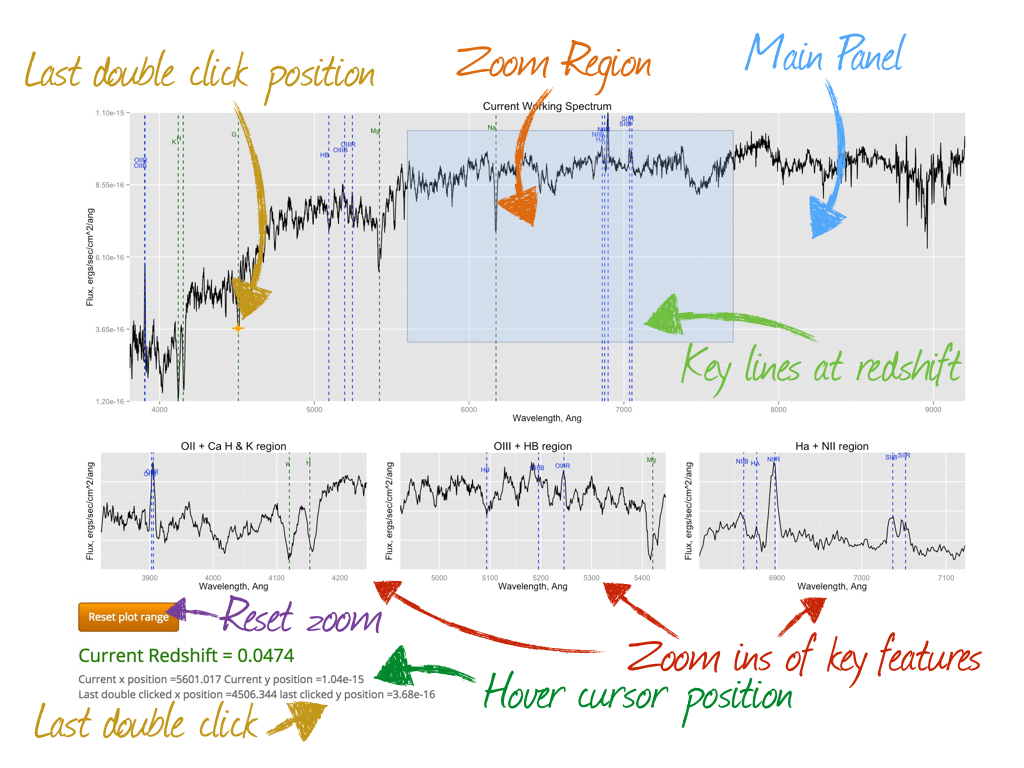
Below the plotting window are various empty tables, which will be descibed below.
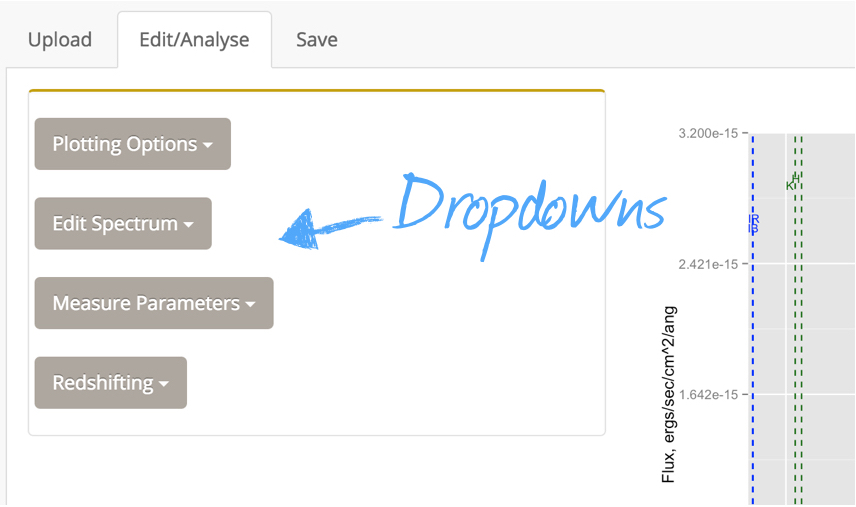
In order to edit and analyse the spectrum there are various dropdow option on the bar on the left hand side.
Plotting Options
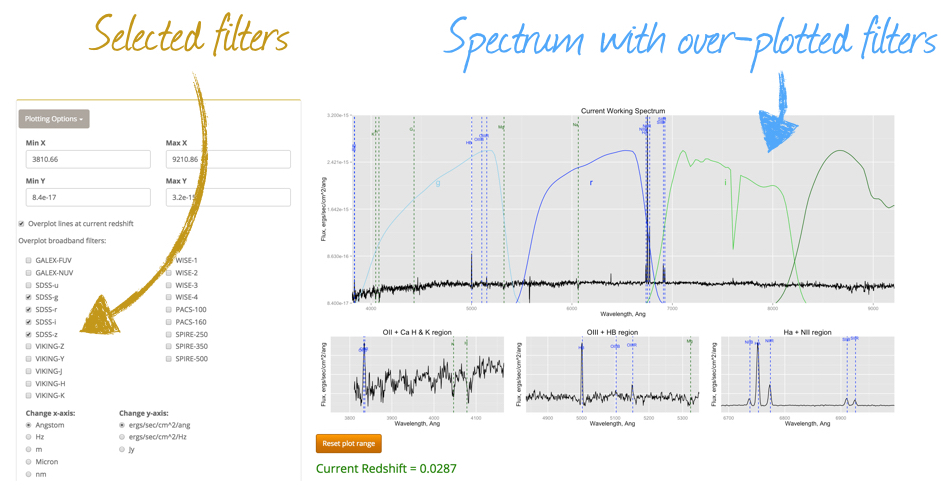
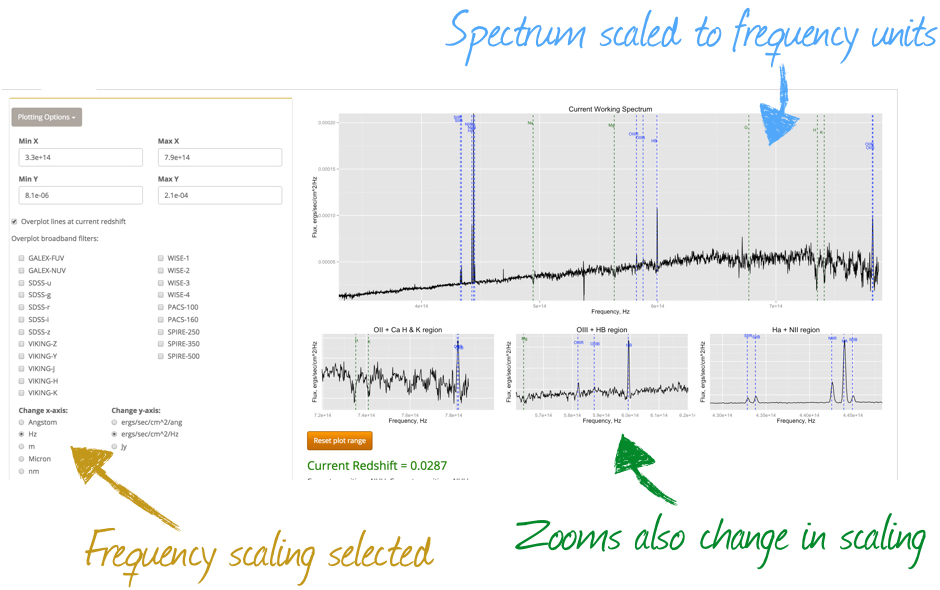
Under the "Plotting Options" drop-down you can firstly manually change the x- and y-range over which your spectrum is displayed. If you interactively zoom within the plot window, these values will update automatically. You can toggle the overplotting of emission lines and oveplot the normaised filter responses of frequently used used photometric filters.
Lastly you can change the units of both the x-and y-axis. SpecFit will rescale the spectrum to the deisred units and update the plotting range.
Edit Spectrum
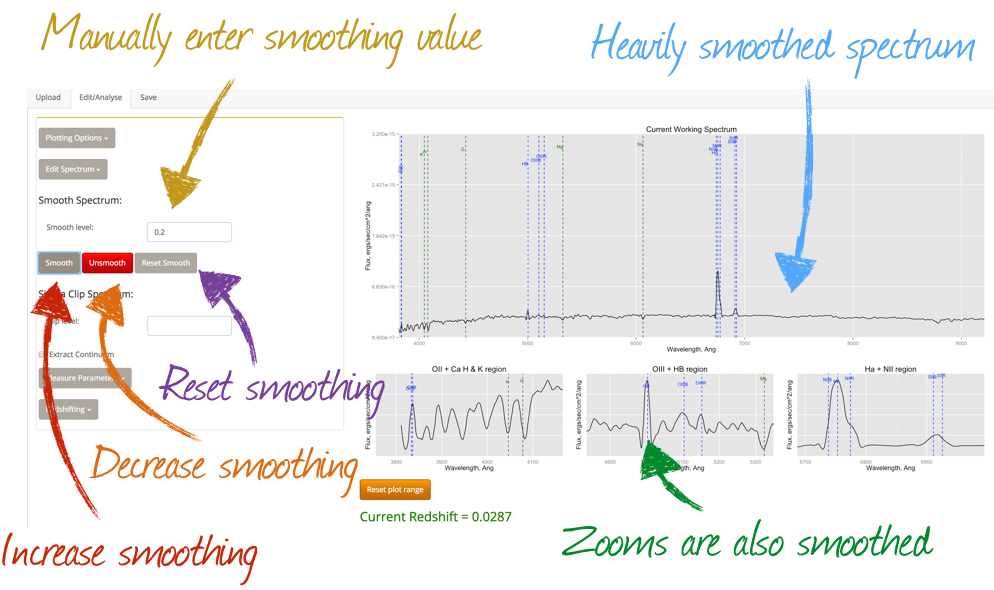
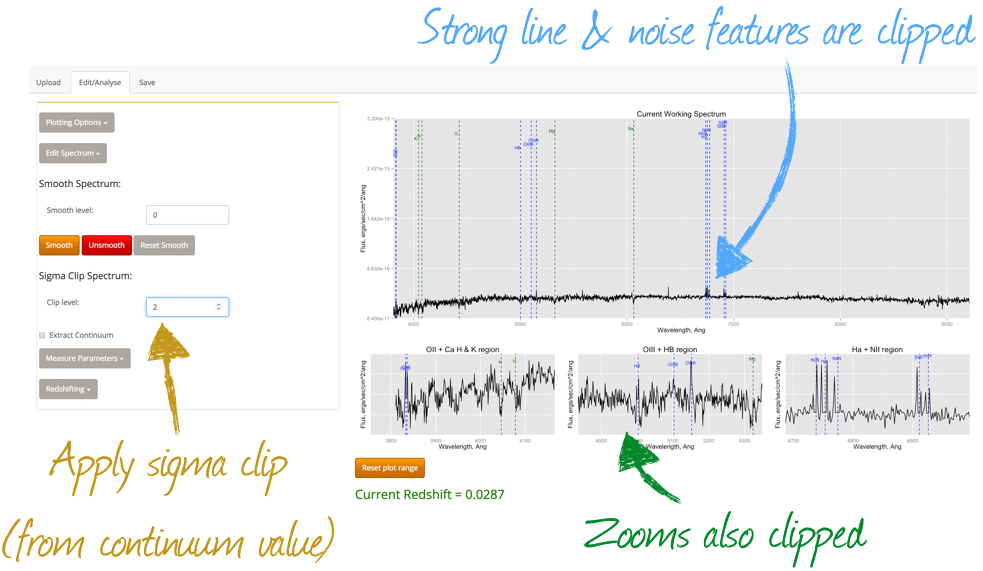
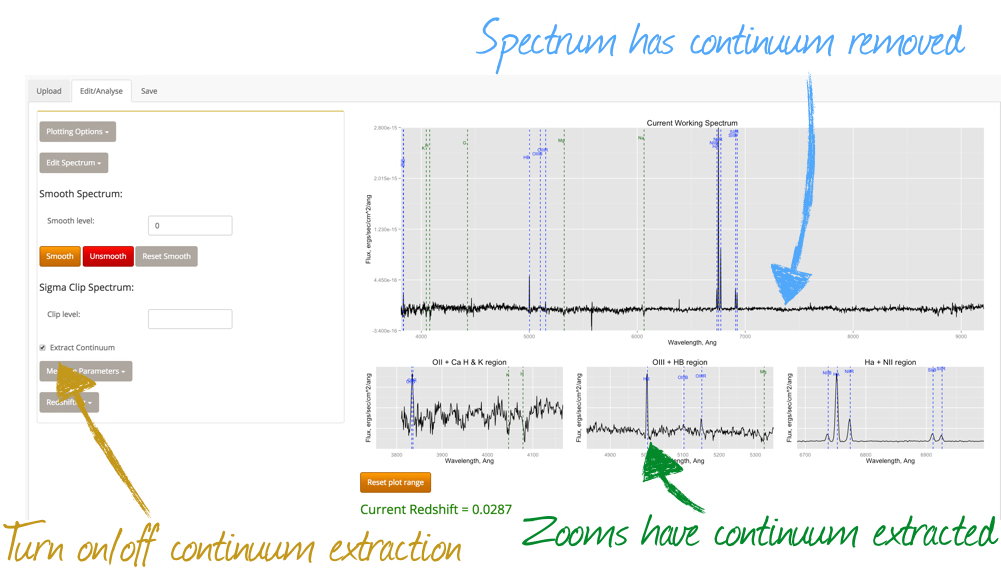
Next you can apply some basic edits to the spectrum under the "Edit Spectrum" tab. Here you can smooth the spectrum, apply a sigma clipping value (sigma above the continuum) and extract the continuum. SpecFit will automatically update all plotting windows to accomodate your changes.
Measure Parameters
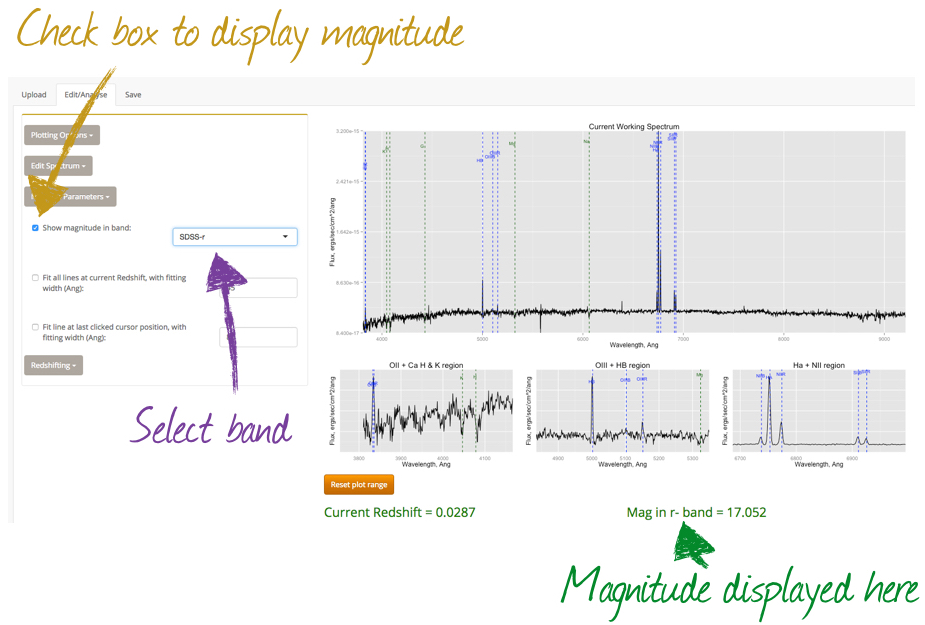
Under the "Measure Parameters" dropdown firstly you can caluculate the spectral magnitude in a given band. Check the box and select a band, SpecFit will convolve your spectrum with the band filter response and calculate and observed magnitude. This is then displayed in green below the plotting window.
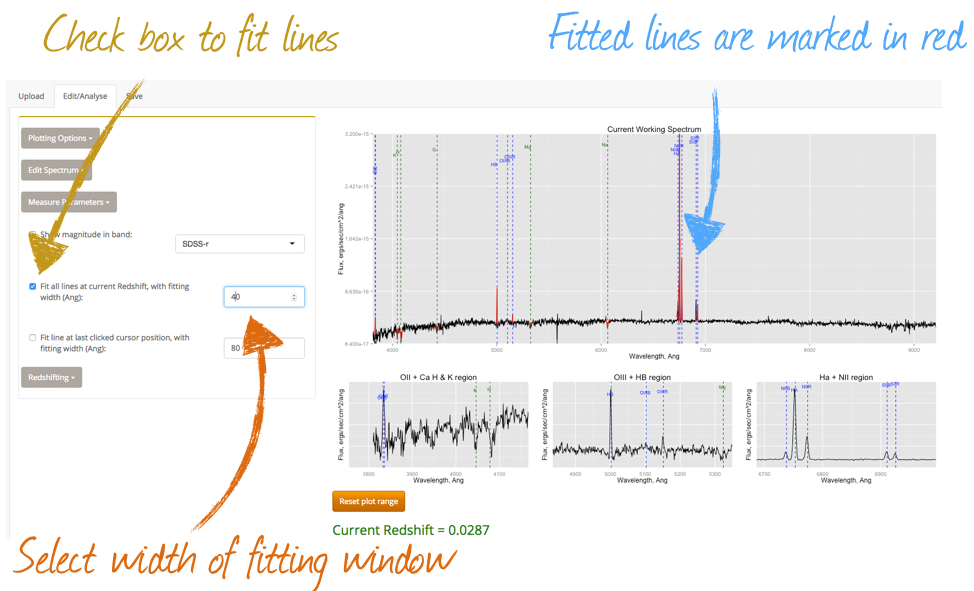
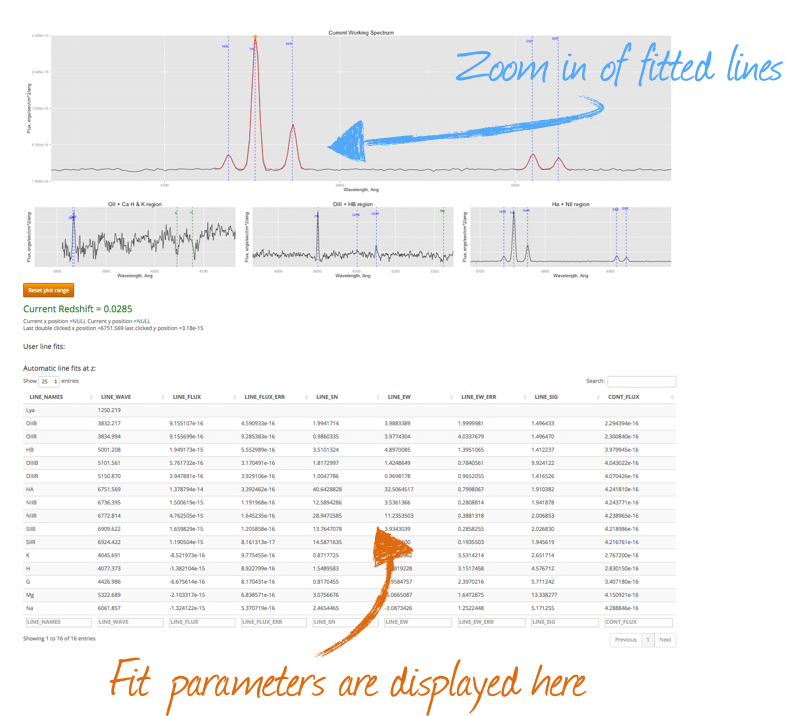
Secondly you can get SpecFit to estimate emission and absortpion line fluxes for major spectral features. Select the "Fit lines at current redshift..." box and SpecFit will do the rest! In the plotting window all fit lines are marked in red. SpecFit uses a single componenet Gaussian fit to the lines and fits over a specified window. You can maually select this window in the box next to this option, play around with this width until you thing the lines are well fit. Under the plotting window you will now see a table showing all of the lines that have been fit. The table gives parameters of line name, wavelength, flux, flux error, S/N, EW, EW error and sigma width of the Gaussian fit.
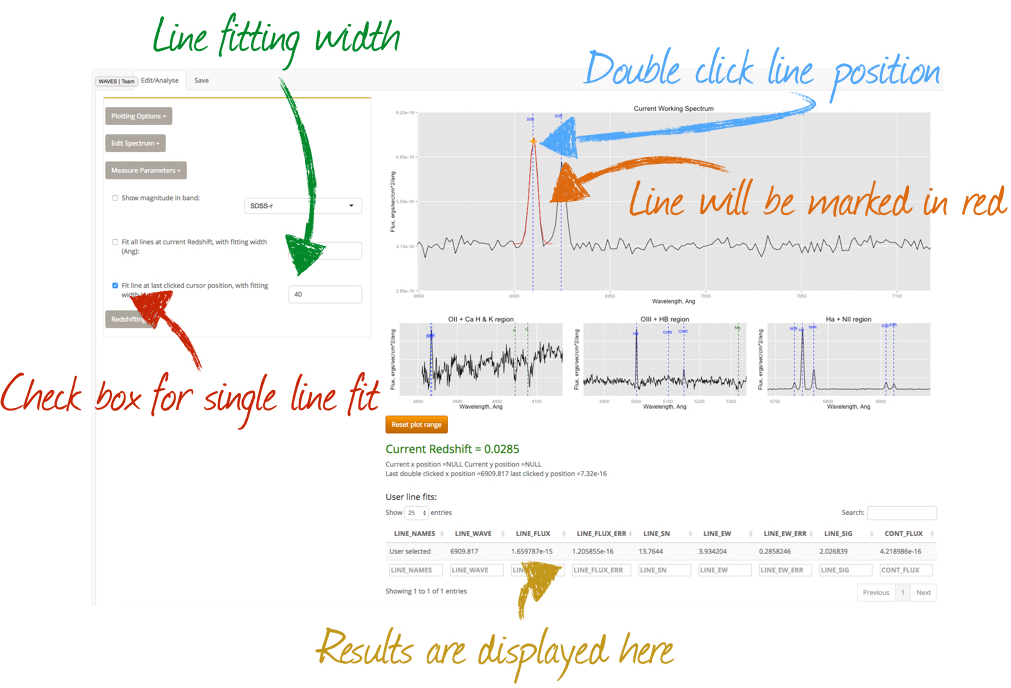
SpecFit also allows you to fit any line in your spectrum manually. Firstly click the "Fit line at cursor position..." box. Now where ever you double click you SpecFit will try to fit a single componenet Gaussian to a region around the last double clicked location. You can also change the fitting width as before. Notice a new table has appeared below the plot window which displays the parameters of your fit.
Redshifting
Under the "Redshifting" drop-down you can assign a new redshift to the spectrum in various ways. Firstly, you can do this manually in the box provided. Secondly you can allow the AUTOZ code (Baldry et al., 2014) to automatically fit the redshift, and thirdly you can assign a specific line in the spectrum. In the later of these simply double click on the line you wish to identify in the plotting window and then click the box corresponding to that feature. SpecFit will automatically update the redshift of the source. If you wish to return the redshift to it original value, hit the "Reset z" button.
Save
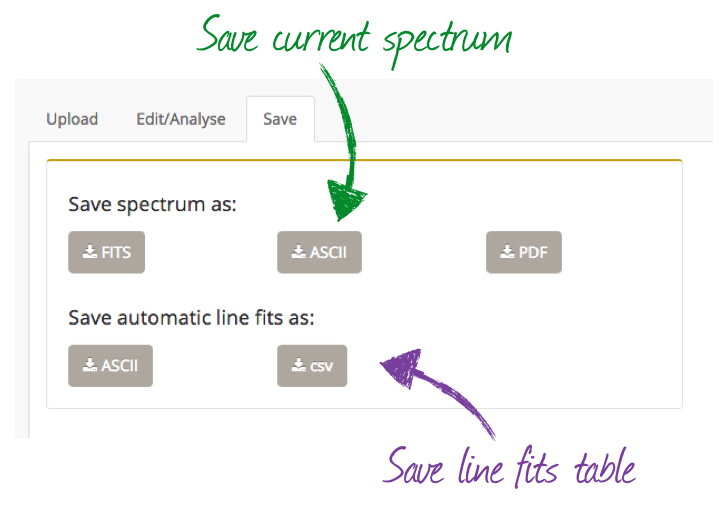
Finally, you may wish to save your edited spectrum and/or you automatic line fits table. On the "Save" tab you can save your current spectrum as either FITS, ASCII or PDF. You can also save the automatic line fits in the table under the plotting window as ASCII or csv.
User line fits:
Automatic line fits at z:
The code for this project was written, and is maintained by Luke Davies
Site, styling and interface created by Liz Mannering